Electrocardiogram (ECG): working principle, normal ECG wave, application of ECG
- Electrocardiogram refers to the recording of electrical changes that occurs in heart during a cardiac cycle. It may be abbreviated as ECG or EKG.
Electrocardiograph:
- It is an instrument that picks up the electric currents produced by the heart muscle during a cardiac cycle of contraction and relaxation.

Working principle of electrocardiograph:
- It works on the principle that a contracting muscle generates a small electric current that can be detected and measured through electrodes suitably placed on the body.
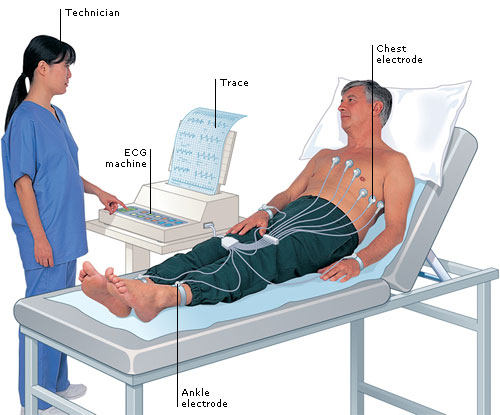
- For a resting electrocardiogram, a person is made to lie in the resting position and electrodes are placed on arms, legs and at six places on the chest over the area of the heart. The electrodes are attached to the person’s skin with the help of a special jelly.
- The electrode picks up the current and transmit them to an amplifier inside the electrocardiograph. Then electrocardiograph amplifies the current and records them on a paper as a wavy line.
- In an electrocardiograph, a sensitive lever traces the changes in current on a moving sheet of paper.
- A modern electrocardiograph may also be connected to an oscilloscope, an instrument that display the current on a screen.
Normal ECG wave:
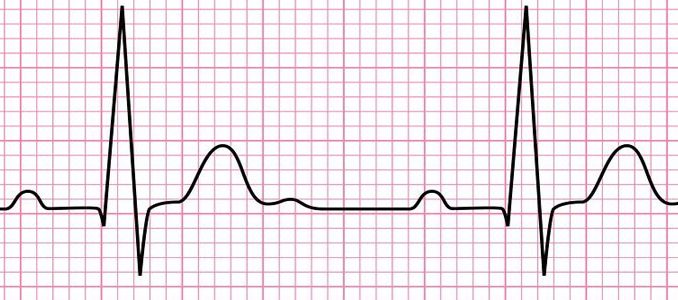
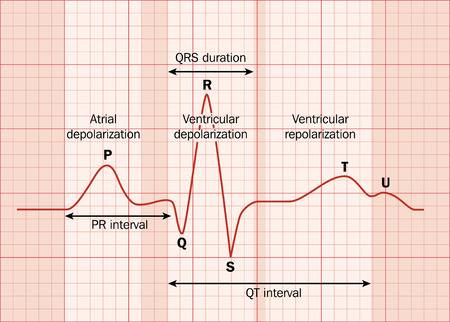
- A normal ECG makes a specific pattern of three recognizable waves in a cardiac cycle. These wave are- P wave, QRS wave and T-wave, P-R interval, S-T segment

-
P-wave:
- It is a small upward wave that appears first
- It indicates atrial depolarization (systole), during which excitation spreads from SA node to all over atrium
- About 0.1 second after P-wave begins, atria contracts. Hence P-wave represents atrial systole
-
QRS wave:
- It is the second wave that begins as a little downward wave but continues as a large upright triangular wave and ends as downward wave
- It represents the ventricular depolarization (systole)
- Just after QRS wave begins, ventricles starts to contracts. Hence QRS wave represents ventricular systole
-
T- wave:
- It is third small wave in the form of a dome-shaped upward deflection.
- It indicates ventricular repolarization (diastole)
- It also represents the beginning of ventricular diastole
- ** ATRIAL DIASTOLE MERGES WITH QRS-WAVE
-
P-R interval:
- It represents the time required for an impulse to travel through the atria, AV node and bundle of his to reach ventricles.
-
S-T segment:
- It is measured from the end of S to the beginning of T- wave
- It represents the time when ventricular fibres are fully depolarized.
Application of ECG:
- it indicates the rate and rhythm or pattern of contraction of heart
- it gives a clue about the condition of heart muscle and is used to diagnose heart disorders
- it helps the doctors to determine whether the heart is normal, enlarged or if its certain regions are damaged
- it can also reveal irregularities in heart’s rhythm known as ‘arrhythmia’
- it is used by doctors to diagnose heart damage in conditions like high blood pressure, rheumatic fever and birth defects
- an ECG also helps to determine the location and amount of injury caused by heart attack and later helps to assess the extent of recovery
Significance of different waves in an ECG deviating from normal ECG
- Enlarged P-wave:
- It indicates enlarged atrium (it occurs in a condition called mitral stenosis in which due to narrowing of mitral valve, blood backs up into left atrium)
- Enlarged Q-wave: downward wave
- It indicates a myocardial infraction ( heart attack)
- Enlarged R- wave:
- It indicates enlarged ventricles
- Long P-Q interval:
- It indicates more time taken by impulse to travel through atria and reach ventricles
- It happens in coronary artery disease and rheumatic fever when a scar tissue may form in heart
- Elevated S-T segment:
- When S-T segment is above the base line, it may indicates acute myocardial infraction
- Depressed S-T segment:
- It indicates that heart muscles receive insufficient oxygen
- Flatter T-wave:
- It indicates insufficient supply of oxygen to heart muscle as it occurs in coronary artery disease
- Elevated T-wave:
- It may indicates increased level of potassium ions in blood as in hyperkalemia
