Principle:
The quantitative detection of the bacterial population is needed for various studies.
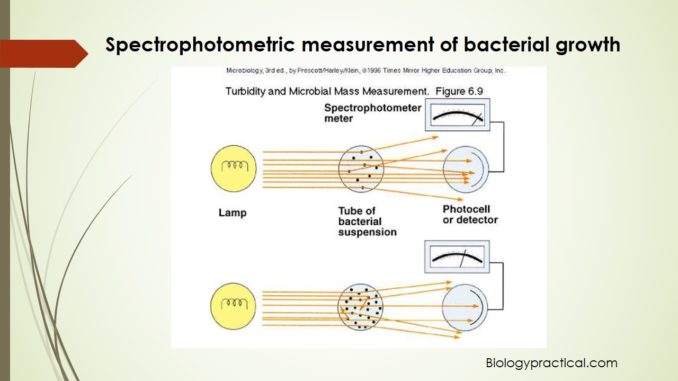
There are basically two methods used for the counting of bacterial population i.e. either viable or plate count method and spectrophotometric (turbidimetric) analysis. Spectrophotometric method is an indirect technique that estimates total cell biomass i.e. both alive and dead. This technique is based on turbidity i.e. the bacterial population is detected by calculating turbidity or optical density (cloudiness of a suspension) of a broth culture. Increased turbidity in a culture is indicator of bacterial growth and biomass, as turbidity is directly proportional to the number of cells. Spectrophotometer measures the amount of light transmitted or absorbed directly through a sample and thus quantifies the turbidity. As the cell population increases, the amount of transmitted light decreases. The amount of light energy transmitted through the suspension is measured as percentage of transmission or %T on the spectrophotometer as 0% to 100%. This transmitted light is now converted to electrical energy, and this is specified on a galvanometer. The reading, is termed as absorbance or optical density, indirectly indicates the number of bacteria. Absorbance is a logarithmic value and is used to plot bacterial growth on a graph. This method is rapid in comparison to standard plate count but is limited as the sensitivity is confined to bacterial suspensions of 107 cells or greater.
Requirements:
- Test tubes each containing 5ml of nutrient broth
- 24-hour nutrient broth culture of Bacillus cereus
- Sterile 1ml serological pipette
- UV spectrophotometer
- Bunsen burner
Procedure:
- Using a sterile 1ml pipette, inoculate six labelled tubes (as 0, 2, 4, 6, 8, 16 and 24) of nutrient broth each with 0.1ml of the B. cereus culture.
- The remaining seven uninoculated broth tubes are served as blanks for adjusting the spectrophotometer.
- Incubate all the 13 tubes at 30°C for 24 hours.
Observations:
- Observe the inoculated cultures following incubation at an interval of 0, 2, 4, 6, 8, 12 and 24 hours for the amount of growth which is determined by measuring the turbidity (i.e. percent transmission) of inoculated broth by using spectrophotometer.
- Measurement of turbidity:
- The steps for measurement of turbidity are as follows:
- Turn the spectrophotometer on by rotating the zero control knob clockwise.
- Let the instrument to warm up for 15 minutes.
- Set wavelength at 600 millimicrons.
- Adjust the zero control to set % transmittance to 0% (O.D. to 2) by bringing the knob on the left.
- Wipe clean an un-inoculated tube of broth, with tissue paper to remove all liquids and finger prints, which will serve as the blank.
- Place the blank into the sample holder and close the cover.
- To standardize the instrument set the % transmission to 100 by turning the knob to the right.
- Thoroughly mix the contents of an inoculated tube (labelled O). Wipe the test tube clean and keep for some seconds allowing the medium to settle.
- Remove the blank from the sample holder.
- Place the inoculated tube into the sample holder, close the holder cover and read the % transmittance from the scale.
- Remove the broth culture from the sample holder.
- Take readings of percent transmittance for all the inoculated tubes labelled 2, 4, 6, 8, 12 and 24 repeating all the steps 1 to 11 after the desired interval of time.
Results interpretations:
- Calculate the absorbance (O.D.) for all the inoculated tubes by applying the formula:
- Absorbance= -log
(%T)/100
- Plot the readings in terms of absorbance versus the time at which readings were taken.
- It will be observed that the turbidity of some inoculated tubes increases with the incubation period, the O.D. would be found to increase while % T would be found to decrease specifying more growth of the cell population in the culture with increased incubation period.
